


IFS Election 2017 analysis is being produced with funding from the Nuffield Foundation as part of its work to ensure public debate in the run-up to the general election is informed by independent and rigorous evidence. For more information, go to http://www.nuffieldfoundation.org
Key findings
1. Labour proposes to increase income tax for the 1.3 million people with taxable income exceeding £80,000 per year: the highest-income 2% of adults, or 4% of income tax payers. Currently this small group receive more than 20% of all taxable income and pay more than 40% of all income tax.
2. The tax revenue that Labour’s proposal would raise is highly uncertain. If no one changed their behaviour in response, it would raise around £7 billion per year. But some of those affected would respond by reducing their taxable incomes, reducing the amount raised. The size of the response is highly uncertain and the revenue raised is highly sensitive to the size of the response. Labour expects the policy to raise in the region of £4.5 billion per year. Based on the available evidence this looks a little on the optimistic side, but it is entirely possible. However, it is also possible that the policy would raise nothing.
3. High-income individuals could respond to the policy in a number of ways. One straightforward response for many would be to increase their contributions to private pensions, which bring up-front income tax relief. They could also work less, make greater efforts to avoid or evade tax, emigrate, or not come to the UK in the first place.
4. Losses in cash terms would be highly concentrated on those with the highest incomes. If no one changed their behaviour then the 500,000 people with income between £80,000 and £100,000 would lose an average of £400 a year, while the 50,000 people with income over £500,000 would all lose at least £22,900 a year.
5. Labour’s proposal would be the latest in a series of income tax increases for this group. Since April 2010 the introduction of the 50% rate (later reduced to 45%), the withdrawal of the personal allowance from those with incomes above £100,000, and a succession of restrictions to tax relief on pension contributions have all increased the income tax paid by those with the highest incomes.
6. The proposals would miss an opportunity to rationalise the income tax system for those on higher incomes. The planned overhaul of the taxation of those on higher incomes would have been an obvious chance to remove the absurd and arbitrary marginal income tax band between £100,000 and £123,000, which arises from the policy described as withdrawing the personal allowance. Instead Labour’s proposals would leave this in place, and would increase the marginal income tax rate from 60% to 67.5% within that band - or from 66.6% to 73.2% once employer and employee National Insurance contributions, as well as income tax, are included.
Labour proposes substantial increases in income tax rates for those on higher incomes
Figure 1. Income tax schedule in 2017–18 with and without proposed Labour reforms

Source: Authors’ calculations using HMRC income tax statistics. See the appendix for details.
The Labour Party proposes to increase income tax for individuals with a taxable income exceeding £80,000 per year. Throughout this briefing note we assume that the changes would apply immediately across the UK, though income tax on non-dividend and non-savings income is now devolved to the Scottish Parliament, which might choose a different policy.[1]
Labour’s proposal would affect 1.3 million people – a relatively small group but one that is already a very important source of revenue. Between them they have over 20% of all of the income of income tax payers, and they pay over 40% of all income tax.
Figure 1 illustrates the proposed tax increases. The green line shows the marginal rate of income tax (that is, the rate applied to the next £1 of income) currently levied at different levels of taxable income. The red line shows how this would change if Labour’s proposals were in place now.
The current system works as follows:
- The basic rate of income tax is 20% and it kicks in at £11,500 a year. Around 24 million people pay that marginal rate: around half of adults, or over 80% of income tax payers (since almost 45% of adults do not have income high enough to pay income tax).
- The higher marginal rate of income tax is 40% and it kicks in at £45,000 per year. About 4 million people pay that marginal rate (8% of adults, or 15% of income tax payers).
- There is effectively a marginal income tax rate of 60% on income between £100,000 and £123,000. This is the opaque consequence of a policy described as the withdrawal of the personal allowance from individuals on more than £100,000.[2] About 300,000 of the 4 million formally paying the ‘headline’ 40% marginal rate are in fact paying this effective 60% marginal rate.
- An additional rate of 45% kicks in at £150,000 per year. A further 350,000 people pay that (0.6% of adults, or 1.1% of income tax payers).
What does Labour propose?
- A new marginal income tax rate of 45%, starting from £80,000 per year. This means a tax rise for the 1.3 million people with an income above that level: the highest-income 2% of adults (or 4% of those who pay income tax)
- A new marginal rate of 50% starting from £123,000 (the point at which the personal allowance has been fully withdrawn). About 500,000 people have income above this level so will pay this new marginal rate (1% of adults, or 2% of those paying income tax).
- In addition to these changes in headline rates, Labour would retain the current policy of withdrawing the personal allowance from individuals on more than £100,000. In combination with the increase in the headline rate from 40% to 45% between £80,000 and £123,000, this increases the current bizarre 60% rate to an even higher 67.5%.
Figure 1 focuses on income tax to highlight the changes Labour is proposing. But it is important to bear in mind that the income tax system sits alongside National Insurance contributions (NICs) made by both employees and employers. For those on higher incomes, the marginal rate of employer NICs is 13.8% and the marginal rate of employee NICs is 2%. It is these taxes in combination with income tax which determine how much of what an employer pays out actually reaches the pockets of its workers. Using that more comprehensive measure of the marginal tax rate for earned income, Labour’s proposals would increase it from:
- 49.0% to 53.4% for those with earnings between £80,000 and £100,000;
- 66.6% to 73.2% for those between £100,000 and £123,000;
- 49.0% to 57.8% for those between £123,000 and £150,000;
- 53.4% to 57.8% for those on more than £150,000.[3]
The income tax system for higher-income people has become increasingly opaque and complex in recent years, due to the withdrawal of child benefit, tapering of annual pension contribution limits, cliff-edge withdrawal of the new transferable married couple’s allowance, and the ‘withdrawal of the personal allowance’ from £100,000. A restructuring of the income tax system for those on the highest incomes would have been an obvious opportunity to get rid of the bizarre and opaque 60% marginal income tax rate band that occurs because of the last policy. It is disappointing that Labour’s proposal does not take that opportunity.
Labour has not been explicit about whether the new £80,000 threshold would be uprated over time. Income tax thresholds should relate to something economically meaningful such as prices, earnings or taxable incomes. But in recent years both main parties have displayed an increasing and worrying habit of proposing or implementing nominal freezes to important parts of the tax and benefit system, including the £100,000 point at which the current effective 60% rate (which would become 67.5% under Labour) kicks in and the £150,000 point where the current 45% rate kicks in. This means that the numbers affected by higher rates increase over time at an arbitrary rate that depends on the rate of inflation as well as the rate of real income growth.
If the new £80,000 threshold were frozen in nominal terms and all taxable incomes were to grow in line with the Office for Budget Responsibility’s forecasts for average earnings[4], about half a million more people would be affected by Labour’s changes (i.e. would have income above £80,000) by 2021–22. There is no economic rationale for keeping thresholds fixed in nominal terms in this way. It would be a good habit to kick.
Who would lose and by how much?
Figure 2. Annual losses from Labour’s proposed income tax rises
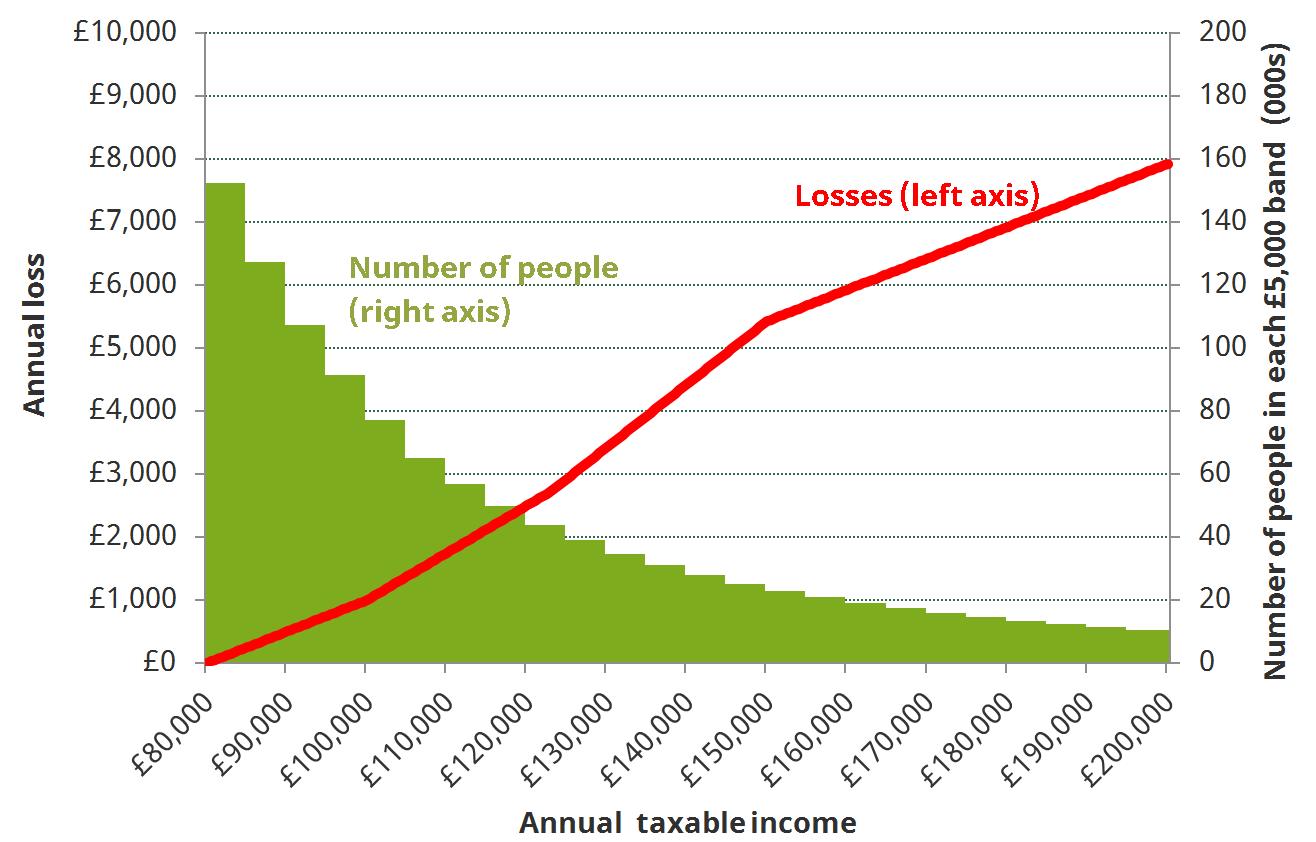
Source: Authors’ calculations using HMRC income tax statistics. See the appendix for details.
Figure 2 shows the consequences of these proposed changes for the income tax liabilities of higher-income individuals. There are many fewer people at the highest income levels shown in the figure than there are at a little above £80,000: the income distribution thins out very quickly at the top. To illustrate this, we overlay on the figure the estimated number of people with taxable income of different levels (in £5,000 bands). Remember also that about 98% of adults would see no change in income tax at all.
Because everyone above £80,000 would face a higher marginal income tax rate under Labour, the absolute sizes of the losses from this package of changes get indefinitely higher the further above £80,000 you look. Hence, although the 1.3 million affected individuals would see an average tax rise of £5,300 per person if they did not change their behaviour, these extra payments are heavily skewed. For example, the 500,000 people (about a third of the losers) between £80,000 and £100,000 would lose an average of £400 per year; the 150,000 people between £150,000 and £200,000 would lose an average of £6,400.
Table 1 picks out some key information about the magnitudes of the losses and how many people would experience such losses, and extends the analysis to even higher-income individuals than shown in Figure 2.
Table 1. Annual losses from Labour’s proposed income tax rises
|
Range of taxable income (£000s) |
Number of people in range |
Range of losses |
|
80-100 |
500,000 |
£0-£1,000 |
|
100-123 |
300,000 |
£1,000-£2,725 |
|
123-150 |
150,000 |
£2,725-£5,425 |
|
150-200 |
150,000 |
£5,425-£7,925 |
|
200-500 |
150,000 |
£7,925-£22,925 |
|
500+ |
50,000 |
£22,925- |
Source: Authors’ calculations using HMRC income tax statistics. See the appendix for details.
All the analysis above considers the impact of the proposals on individuals with different levels of taxable income. However, when considering the distributional impact of tax and benefit reforms, it is usually preferable to look at the effects on households with different levels of net (post-tax and benefit) income, after adjusting for the different needs that households of different sizes have, as this is a better proxy for living standards.
Measured this way, as you would expect, Labour’s proposals would mostly affect the highest-income 10% of households (the ‘top decile’). Over four-fifths of the households who would be affected are in the top decile, and over 97% of the revenue would come from the top decile. The 20% minority who are not in the top household income decile are largely households with children (placing them further down the distribution once we account for their higher needs). Indeed, 70% of those households have at least two dependent children (as opposed to 26% of all households affected).
This high-income group of households has already seen large income tax rises in the years since the financial crisis. Between January 2010 and May 2015, the top decile lost the most from tax and benefit changes as a percentage of their income, while the rest of the richer half of households were remarkably well protected from austerity. Tax and benefit changes since 2015 have had little impact on the incomes of the top decile on average.[5]
Revenue and behavioural effects
A key issue when changing tax rates, and a key area of uncertainty here, is the size of any effects on people’s behaviour.
These behavioural effects matter for the amount of revenue that tax rises bring in, which we discuss in some detail in this section. Most fundamentally from an economic point of view, they matter for the size of the economic inefficiency created per pound of revenue raised. The more people reduce their taxable incomes in response to a higher tax rate, the greater the economic inefficiency or ‘deadweight cost’ of the tax, i.e. the greater the amount by which the welfare loss to taxpayers exceeds the revenue generated for the exchequer.
Labour has indicated that it expects to raise around £4.5 billion per year from the changes.[6] As we stress below, there is a lot of uncertainty about how much the policy would actually raise. Below we discuss the sources of uncertainty and illustrate the sensitivity of the answer to different plausible assumptions.
If there were no change in taxpayers’ (pre-tax) incomes as a result of Labour’s proposed income tax rises, they would raise around £7 billion per year. That’s the easy bit of the calculation. However, in reality it is highly likely that the changes would raise less than this as some high-income individuals would respond to the higher tax rates by working less (e.g. retiring earlier), increasing the extent to which they (legally) avoid or (illegally) evade taxes, or even emigrating (or not moving here in the first place). These kinds of potential responses vary in their likely frequency, but some are relatively straightforward for many individuals to do. For example, someone with a taxable income of £100,000 a year could, under Labour’s proposals, get up-front income tax relief on any additional pension contributions at 45% (rather than 40% currently).
The question, then, is how much of the potential £7 billion the exchequer would lose to behavioural responses.
A sizeable international literature finds evidence of such responses to income tax changes, particularly among high income individuals.[7] In the UK, the official HMRC analysis of the introduction (in 2010–11) of the short-lived 50% tax rate on incomes above £150,000,[8] and ongoing work by IFS researchers using updated data and different methods,[9] find evidence of significant responses to that change. The magnitudes of the responses are highly uncertain, however, and even relatively small changes in the sizes of responses can have large impacts on the revenue raised. Hence, the most important thing to understand is the degree of uncertainty about impacts on revenue.
The relevant measure of responsiveness can be summarised by the ‘taxable income elasticity’ (TIE). This tells you by what percentage the income reported to the taxman changes when the marginal net-of-tax rate changes by 1% (the net-of-tax rate is just the percentage of the income that is not taxed away, i.e. 100% minus the marginal tax rate). The higher this TIE, the more responsive are taxpayers to changes in tax rates and the less revenue increases in tax rates would raise. And when the TIE is high enough, increases in the tax rate can actually reduce revenues, as the losses from taxpayers reducing the amount of income they declare can more than offset the money raised as a result of higher tax rates: the so-called ‘Laffer curve’ effect.
HMRC’s central estimate of the TIE for taxpayers with incomes above £150,000 (i.e. those affected by the introduction of the 50% tax rate in 2010) was 0.48. However, the statistical uncertainty surrounding this central estimate was very large; and in addition, relatively modest changes to HMRC’s methodology can lead to big changes in the ‘central’ estimate. One particular difficulty is distinguishing temporary shifts in the timing of income around the moment that tax rates change (in particular, bringing income forward so that it is taxed at the lower, pre-reform rate) from permanent effects on behaviour.
A TIE estimated for those with incomes above £150,000 also seems unlikely to be the best estimate of the level of responsiveness for the 950,000 people between £80,000 and £150,000, who would also be affected by Labour’s proposals. We have no recent estimates of the TIE for this latter group of taxpayers. But the evidence we do have suggests it is reasonable to assume that this group is less responsive than those with the very highest incomes. In Budget 2012, for instance, following a review of the evidence, HM Treasury assumed a TIE of just 0.03 for those individuals affected by cuts to the higher-rate tax threshold (affecting those with incomes of more than around £43,000). IFS analysis of responses to the 50% tax rate suggests that the TIE for those close to the £150,000 threshold was 0.1 to 0.2 – the much higher 0.48 figure being driven by the high level of responsiveness of those with the very highest incomes.[10]
To give a sense of how important the scale of these behavioural responses is to the revenues that would be raised from Labour’s plans, we can examine the sensitivity of revenue estimates to assumptions about the relevant TIEs, drawing on the evidence available.
Figure 3 shows our estimates of how much revenue Labour’s plans would raise in three different plausible scenarios for degrees of responsiveness, along with the revenue estimate in the – implausible – scenario of no behavioural responses at all.
- In the first scenario (’low responsiveness’), we assume that the TIE for those between £80,000 and £150,000 is 0.03, and that the TIE for those above £150,000 is 0.28. These elasticities are below the central estimates in each case, but well within the bounds of possibility.
- In the second scenario (’medium responsiveness’), we assume the TIEs are 0.13 and 0.48 respectively –approximately central estimates.
- In the third scenario (‘high responsiveness’), we assume the TIEs are 0.23 and 0.68 – above the main central estimate in each case but again well within the bounds of possibility.
Figure 3. Uncertain revenues from Labour proposal
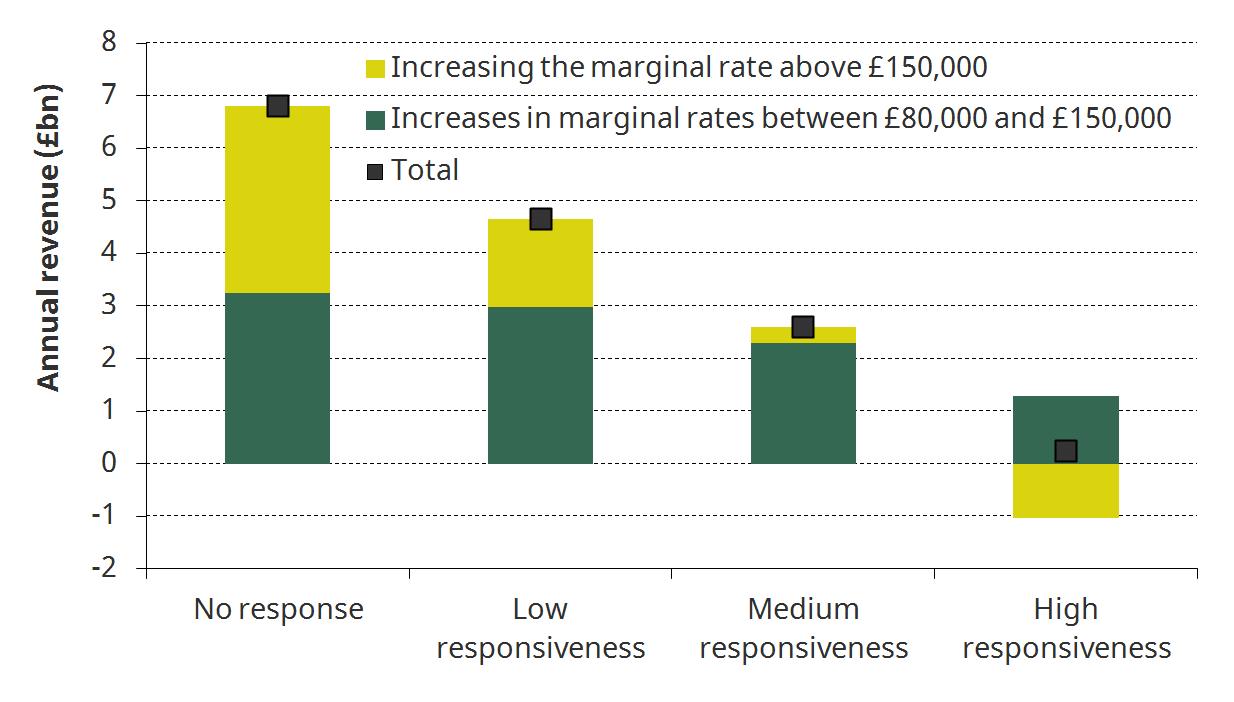
Source: Authors’ calculations using HMRC income tax statistics. See the appendix for details.
The figure shows quite how uncertain the revenues from this proposal are. While in the ‘medium responsiveness’ scenario the policy raises around £2½ billion per year, in the ‘low responsiveness’ scenario it raises around £4½ billion a year (as Labour expects) and in the ‘high responsiveness’ scenario it raises next to nothing. It is important to remember that these are illustrative scenarios, not upper and lower bounds on what is possible: the revenue yield could be greater than £4½ billion a year, or the policy could actually reduce the tax take. On the basis of the available evidence it does seem more likely than not that the proposal would raise money, but the amount is very uncertain.
The yellow bars in the figure also illustrate that the revenue from raising the marginal tax rate above £150,000 is particularly uncertain – a gain of over £1½ billion in the ‘low responsiveness’ scenario but a loss of around £1 billion in the ‘high responsiveness’ scenario. In fact, the greater responsiveness of this group means that in all three of our scenarios, the majority of the revenue is raised as a result of changing marginal rates between £80,000 and £150,000 (though most of the revenue would still be coming from those with incomes above £150,000: this group would lose most from higher marginal rates between £80,000 and £150,000 as well as facing the increase in their marginal rate from 45% to 50%).
Appendix
This appendix sets out the method we use in this briefing note to estimate the distribution of taxable income in 2017–18. It involves the following four steps:
1. Tables 2.4 and 2.5 of HMRC’s income tax statistics and distributions provide projections of percentiles of the total income distribution among taxpayers, along with the number of taxpayers above certain income thresholds, in 2016–17.[11]
2. We then uprate these percentiles and thresholds to 2017–18 in line with the OBR’s March 2017 forecast for average earnings growth.[12]
3. We then scale down the proportion of individuals above each threshold in 2017–18 by around 10%. This is to adjust for the fact that the percentiles and thresholds provided by HMRC are for total income, rather than taxable income (e.g. individual pension contributions are not excluded). The adjustment is based on a comparison of the number of people with total income over £150,000 and the number of people paying the additional rate of income tax (the number of people with taxable income above £150,000).
4. Finally, we use a Pareto distribution (assuming a Pareto parameter of 2) to interpolate between the thresholds provided by HMRC to approximate the full distribution of taxable incomes above £80,000. This method provides a good approximation when used as a predictor of known thresholds provided by HMRC.
Notes
[1] Estimates of the revenue raised for the UK exchequer, based on the assumption that the policy applies across the whole of the UK, provide a very close approximation to the revenue that would accrue to the UK government even if the policy were not applied in Scotland. This is because the block grant paid to the Scottish Government would be adjusted based on the change in revenues in the rest of the UK. Hence the Scottish government's decision in this regard would affect its revenues, but not those of the UK exchequer.
[2] For each £1 above £100,000, individuals lose 50p of their tax-free allowance. In other words they are liable for income tax at 40% on an extra 50p of income, which equates to an extra 20p of tax. Adding that to the ’headline’ 40p marginal rate means a 60p marginal rate overall.
[3] This excludes the impact of Labour’s proposed ‘excessive pay levy’ on the employers of those on at least £330,000.
[4] See Office for Budget Responsibility (2017), Economic and Fiscal Outlook (http://budgetresponsibility.org.uk/efo/economic-fiscal-outlook-march-2017/).
[5] See Figures 4 and 5 of A. Hood and T. Waters (2017), ‘The impact of tax and benefit reforms on household incomes’ (https://ifs.org.uk/publications/9164).
[6] http://www.express.co.uk/news/uk/804674/John-Humphrys-roasts-Labour-Jon-Ashworth-over-37bn-NHS-pledge-jeremy-corbyn-election.
[7] E. Saez, J. Slemrod and S. Giertz (2012, ‘The Elasticity of Taxable Income with Respect to Marginal Tax Rates: A Critical Review’, Journal of Economic Literature, 50(1), pp3-50.
[8] HMRC (2012), ‘The Exchequer effect of the 50% additional rate of income tax’, available online at the UK National Archives.
[9] https://ifs.org.uk/publications/7675.
[10] The 0.1 and 0.2 figures are based on analysis of statistical data from HMRC which are Crown Copyright. The research data sets used may not exactly reproduce HMRC aggregates. The use of HMRC statistical data in this work does not imply the endorsement of HMRC in relation to the interpretation or analysis of the information. The analysis was cleared for publication in July 2015 in order for a work-in-progress presentation at the European Economic Association Annual Conference in Mannheim. Updated versions of this analysis are currently being finalised and will be published in due course.
[11] See https://www.gov.uk/government/collections/income-tax-statistics-and-distributions.
[12] See http://budgetresponsibility.org.uk/efo/economic-fiscal-outlook-march-2017/.