


This briefing note describes how local authority spending on adult social care has evolved since 2000-01, what could happen to spending under current plans, and the challenges faced by social care in the long run.
Key findings
- Local authorities are responsible for co-funding care services for adults who cannot afford to meet their care needs. In 2015–16 they spent £16.8 billion in England on these services.
- Local authority spending on adult social care in England fell 8% in real-terms between 2009–10 and 2016–17, but was protected relative to spending on other local authority services.
- The population has been growing, so spending on adult social services per adult fell by 13.5% in England. This doesn’t take into account that the population is ageing, which will have put additional pressure on adult social care services.
- Cuts have been greatest where spending, and needs, were previously highest because of how the allocation of grants from central to local government has worked in the last few years.
- Under current plans, councils are set to receive a growing pot of funding intended for social care, which could be worth £5.4 billion in 2019–20 if councils make maximum use of powers to raise council tax.
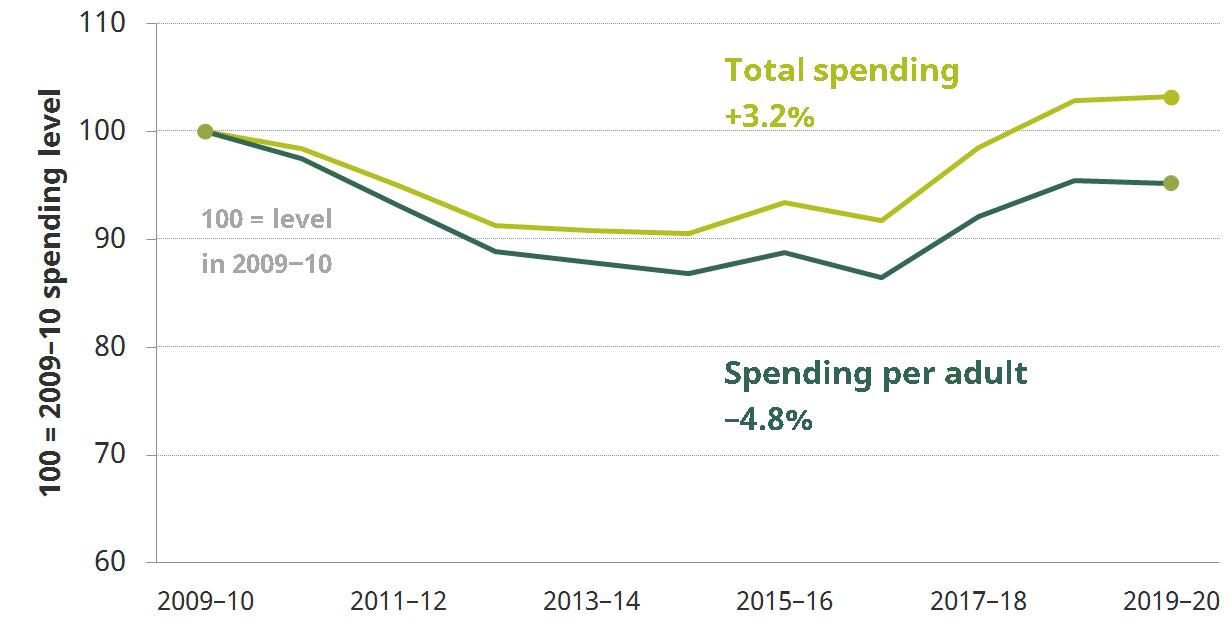
- These new funds potentially give councils enough money to reverse by 2019–20 all the cuts that have been made to social care since 2009–10: spending in 2019–20 could be 3.2% higher than it was in 2009–10 (but still 4.8% lower per adult). This is conditional on local authorities choosing to raise the funds and using them for social care.
- The current government has delayed the implementation of reforms to social care funding proposed in 2011 by the Dilnot Commission, and instead provided short-term injections of funding for the current system. The problems identified by the commission remain. Even if an incoming government does not attempt wider reform, planned reforms to local government funding mean that it is crucial to consider whether our expectations of the social care system are consistent with funding these services through local taxation.
Public spending outside the NHS on adults with care needs and disabilities is around £50 billion annually
Figure 1. Public (non-health) spending on individuals with disabilities or care needs in England in 2015–16 (2017–18 prices)
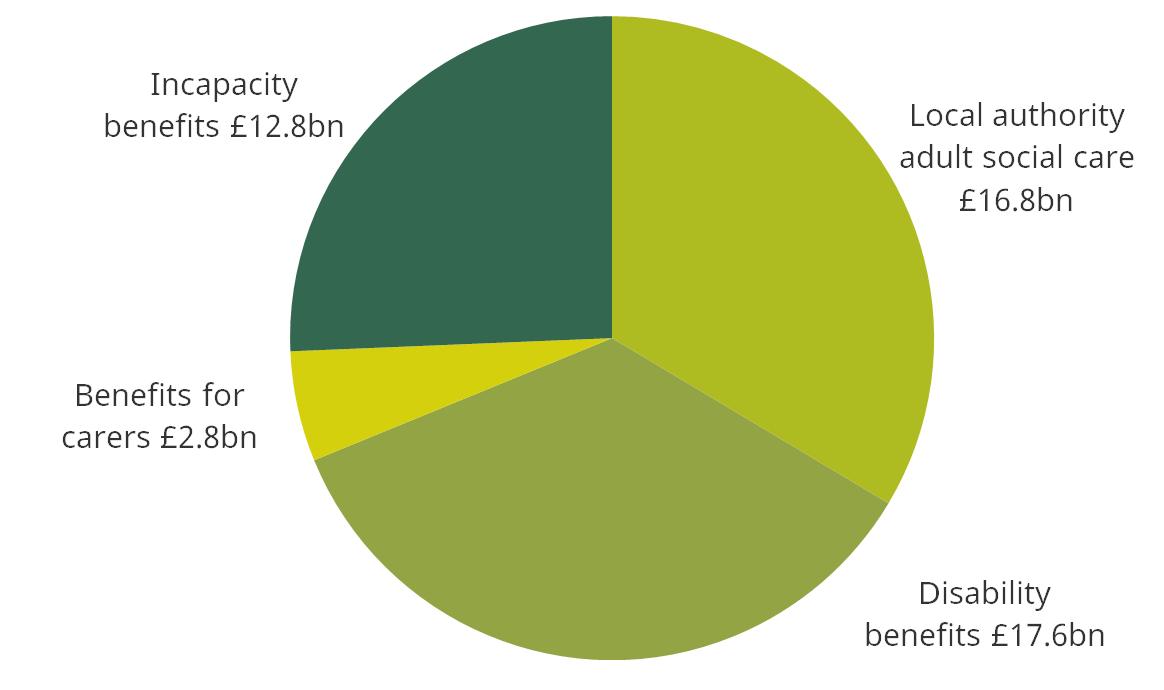
Note: Definitions and data sources for all figures are in Appendix A
In England, it is the responsibility of local authorities to co-fund care services for individuals who have care needs and insufficient financial means to pay for them fully themselves.[1] Minimum eligibility criteria are set nationally, but the amount spent on social care is at local authorities’ discretion. In 2015–16 they spent £16.8 billion (2017–18 prices) on these services.
Local authorities are not the only part of government to contribute to individuals’ care costs. The benefits system provides cash payments to individuals with disabilities to help with their care costs and to compensate them for their inability to work. In addition, though not shown in the figure, if an individual’s care needs are sufficiently severe and strongly related to their healthcare needs, then the entirety of their social care is funded by the NHS under a programme called continuing healthcare.[2]
All three forms of support are important to a full understanding of government assistance for those in need of care, but this note will focus on local authority organised adult social care in England, as this is where the main responsibility for providing access to care lies.
Local authority spending on adult social care in England fell 8% in real-terms between 2009–10 and 2016–17
Figure 2. Spending on local authority-organised adult social care, 2000–01 to 2016–17
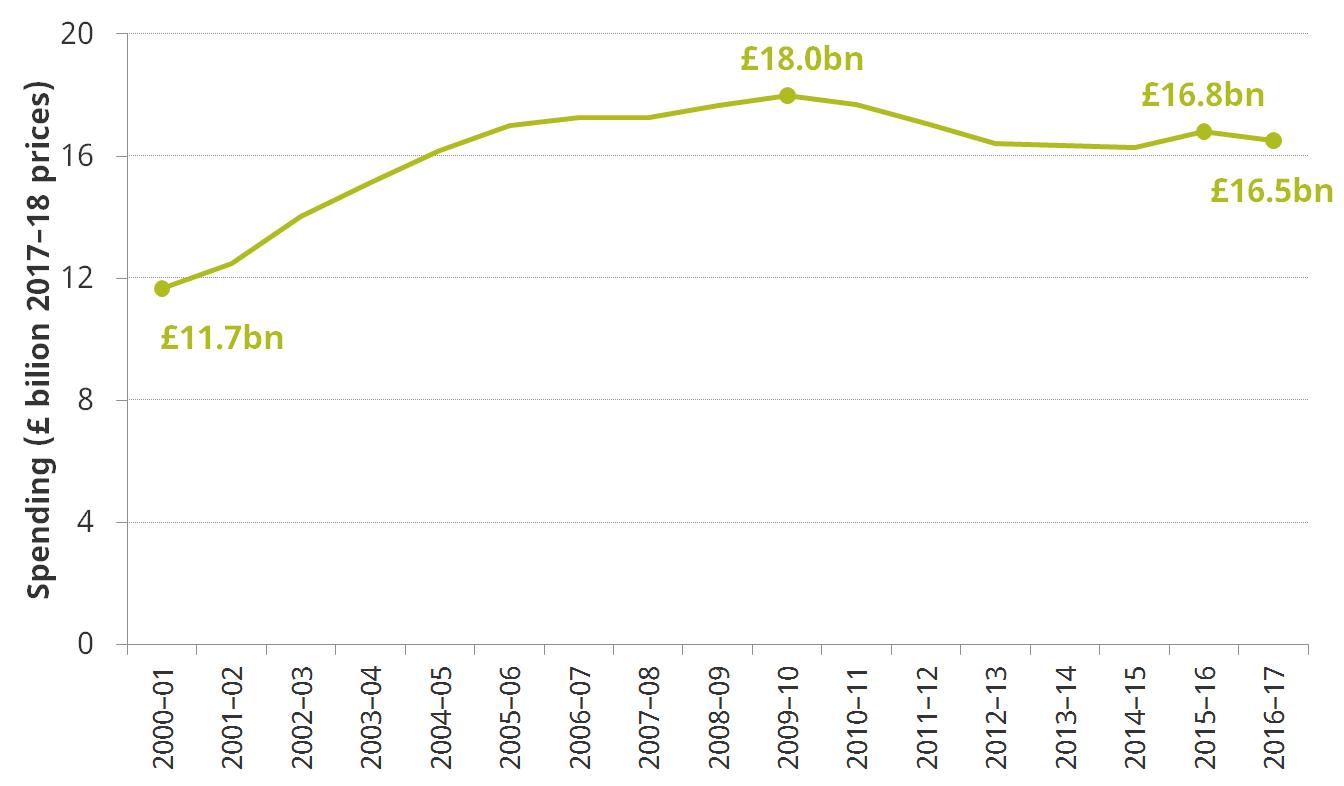
Local authority spending on adult social care grew by 54% (or 5% per year) between 2000–01 and 2009–10, peaking at £18.0 billion. Outturn data show that since then spending fell to £16.8 billion in 2015–16. The latest budget data indicate that the (broadly) downwards trend has continued, with spending falling to £16.5 billion in 2016–17, almost back to its 2004–05 level and 8% down on its peak in 2009–10.
The fall in spending on adult social care occurred despite increases in transfer payments from the NHS to local authorities contributing to the cost of social care. In 2016–17 the NHS contribution to local authority organised adult social care (through the Better Care Fund) was worth around £1.9 billion, 11% of what local authorities spent.
Also over the period 2009–10 to 2016–17, central government grants for local authorities were cut significantly, and as a result their total spending on services fell by 19%. Local authorities protected the social care budget relative to those of other services so spending on social care increased as a share of their service spending from 34% to 39%.
The population has been growing, so spending per adult fell by 13.5%
This is a fall of £59 per adult, from £439 in 2009–10 to £379 in 2016–17. These figures don’t take account of the fact that the population is ageing, which will have put additional pressure on adult social care services. Between 2009 and 2016, the number of people in England aged 65 and over is estimated to have grown by 18% (or 1.5 million people). Over the same period the number of adults aged 85 and over has increased by 17% (or just under 200,000 people).
Cuts have been greatest where spending, and needs, were previously highest
For the period 2009–10 to 2015–16 we can look at changes in spending at the local level. Cuts averaged 11% in real-terms per adult over this period, but varied from real-terms increases in spending per adult for one-in-seven authorities to cuts of more than a quarter to spending per adult for one-in-ten authorities.
There are clear geographic patterns in the distribution of cuts around the country, as shown in Figure 3. London and the North East made cuts of 18% per adult on average, whilst in the South West cuts averaged just 2%.
Figure 3. Average cut to LA-organised adult social care spending per adult by region, 2009–10 to 2015–16
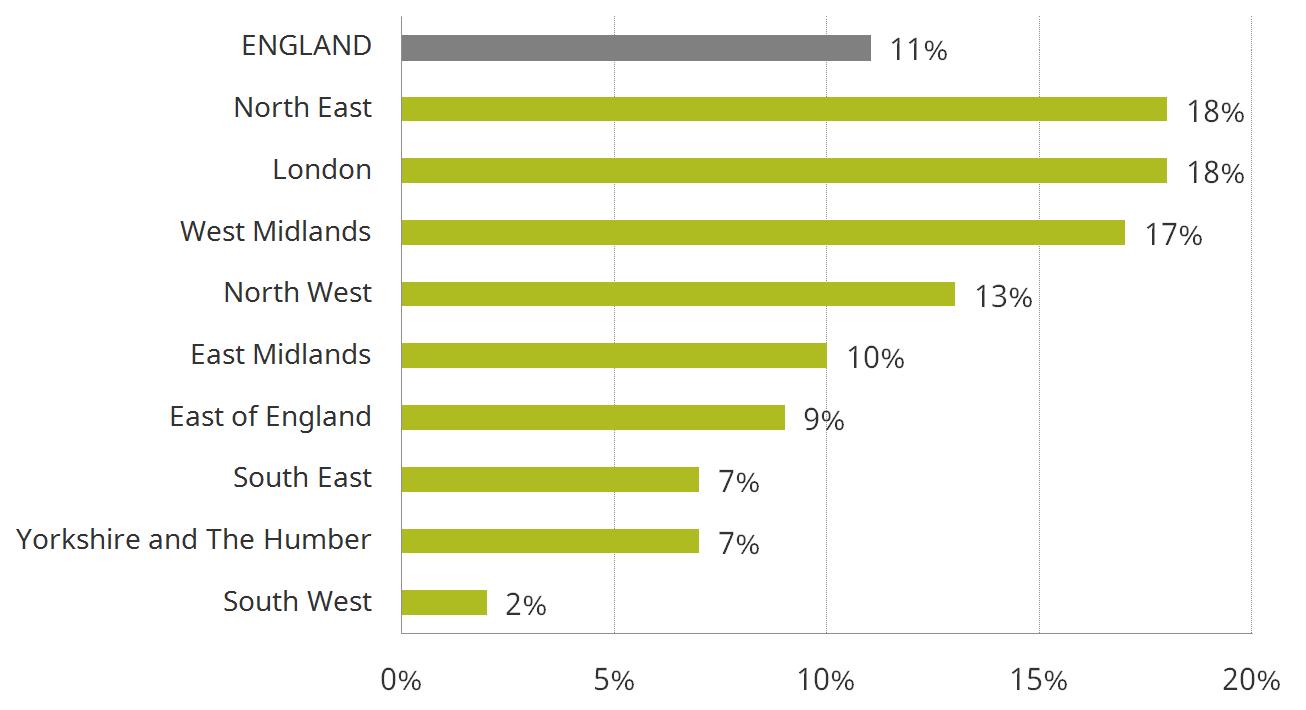
Source: Table 4.1. of Phillips and Simpson (2017) National Standards, Local Risks: the geography of local authority funded social care, 2009–10 to 2015–16
Cuts have also been larger on average in areas with higher social care spending needs, as a result of changes to local government funding over this period. High needs areas typically got more of their funding from central government grants (as opposed to council tax), so faced larger cuts to their total budget over this period. Because social care spending is such a big part of local authority spending, it could not be fully insulated by local authorities, so cuts to these services have followed the same pattern.
Under current plans, councils will have enough money to reverse all social care cuts by 2019-20 if they choose to do so
For the next 3 years, we forecast that councils’ revenues from council tax, business rates and grants (excluding ring-fenced funding for social care) will continue to fall, down a total of 7.2% between 2016–17 and 2019–20 as illustrated in Figure 4 by the lighter green bars. However, on top of this, local authorities will also receive a growing pot of ring-fenced funding for social care, shown as dark green in the same figure. This funding is a mixture of grants (including the Improved Better Care Fund) and potential increases in council tax revenues (called the social care precept, which councils may levy if they wish). Taking into account ring-fenced grants for adult social care, and if all authorities raise the maximum possible from the council tax precept, their total revenues would decrease by just 0.4%.
Figure 4. Local authority revenues, 2016–17 to 2019–20
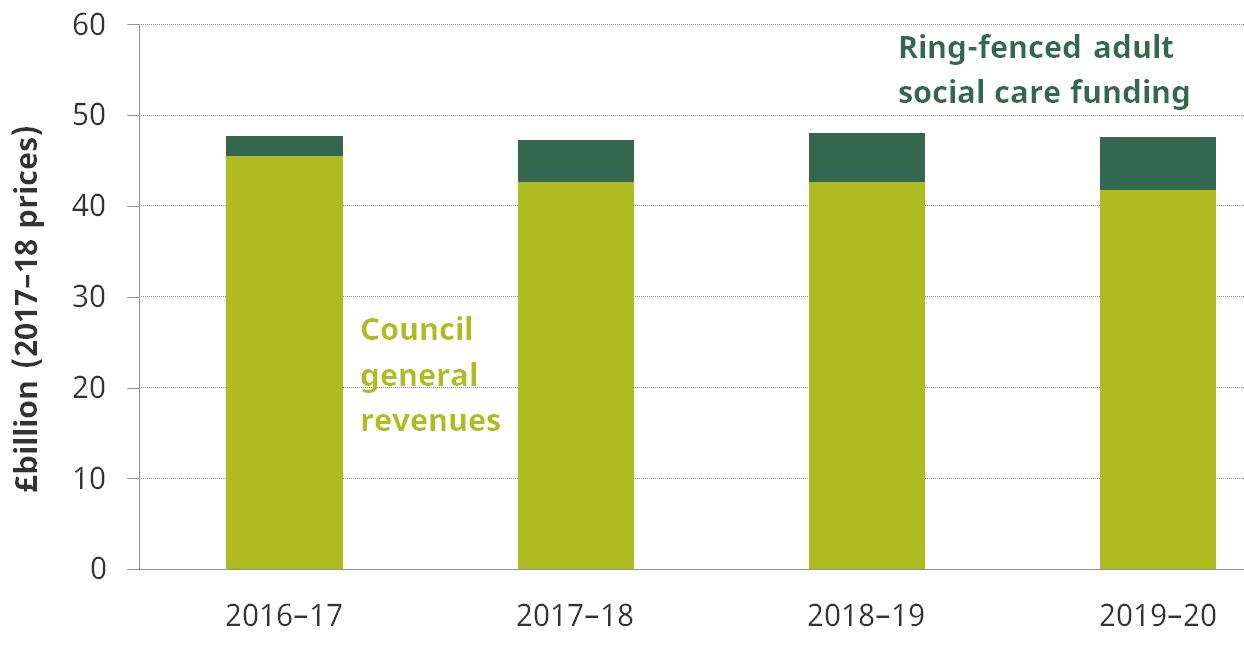
This means that local authorities could have ring-fenced social care funding equal to £5.4 billion in 2019–20. That would be 11% of their overall budget, and 32% of what they spent on adult social care in 2016–17. Figure 5 shows that if local authorities use all of the ring-fenced funding for adult social care services in 2019–20, they would spend a total of £18.6 billion on such services (43% of local authorities’ service spending), 3.2% more than they did in 2009–10.
However, there are two caveats to this statement. First, the funds are not sufficient to keep up with the growing population – social care spending per adult would still be 4.8% lower than in 2009–10. This is shown by the darker green line in Figure 5.
Figure 5. Spending on local authority-organised adult social care, 2009–10 to 2016–17
Second, although this funding is ring-fenced for social care, local authorities may have some flexibility to use it for other services. To satisfy the ring-fence they must demonstrate that they are spending more than they otherwise would on adult social care, but it is difficult to prove that they are not. If some of this funding is used for other services then social care spending will not increase by as much as shown in the figure.
Beyond 2020, the future of adult social care spending is uncertain
For the next three years, we know central government plans but not local authority plans. After 2019–20, we know neither. For any government thinking about the long-term future of social care funding, three questions will be particularly important.
How does social care fit into the overall system of local government finance?
Under current plans, from 2020 local government in England will be funded entirely from council tax and business rates. Every few years, a series of tariffs and top-ups will be set that redistribute revenues across the country (from areas with big tax bases to areas with smaller tax bases) on the basis of their relative spending needs. But for a few years at a time, the transfers across the country will be fixed. For areas with growing revenues, this is good, and will strengthen the incentive for councils to try and stimulate local economic growth. But in areas where needs are going up faster than revenues, there is a risk councils won’t be able to meet growing demand for spending.
This means that in the years between ‘resets’, access to social care could become more unequal across the country. Just how unequal depends on the extent of divergence in revenues and needs around the country, the exact parameters that are set for the local government finance system, and whether social care continues to receive special ring-fenced funding outside of the main system of local government finance.
What would it mean to ensure common standards of social care around the country?
Social care spending per adult varies considerably across the country, and only a quarter of the differences can be explained by observed indicators of local need.[3] This has partly been caused by the distribution of cuts to local government funding over the last few years, and planned additional funding (which is to be allocated on the basis of need) would go some way to matching spending with needs.
Nonetheless, a government that wished to guarantee that people with equal need in different parts of the country receive equal care would find it difficult to do so without taking away local authority discretion over spending (and making eligibility assessment more consistent in practice as well as in principle). From the current position, this would entail both a big redistribution of spending around the country, creating both winners and losers, and would mean a huge reduction in the budgets under local authority control and the discretion available to councils in setting local priorities.
What happened to Dilnot?
Under the coalition government, considerable groundwork was laid for radical social care funding reform. The Dilnot Commission, which reported in July 2011, identified that under the current system individuals faced uninsured risk of very large social care expenditures, and that the means test for publicly funded care was a ‘cliff-edge’. The commission’s proposals for a life-time cap on care costs, and higher means test threshold were accepted by the then government, and the Care Act 2014 created the legislative framework for their implementation. However, the outgoing government has delayed the implementation of the bulk of the reforms and instead provided short-term injections of funding for the current system. The problems identified by Dilnot remain, and the next government will have to decide whether it will finally take the step of implementing these reforms.
There has not been a lack of reviews of social care funding in recent years. It is time to see what the political parties actually want to do, and for some real action from whoever forms the next government.
Notes
[1] For an overview of the eligibility criteria for adult social care, see section 2 of Phillips and Simpson (2017) National Standards, Local Risks: The geography of local authority funded social care, 2009-10 to 2015–16.
[2] For a brief overview of the NHS continuing healthcare programme, see Annex B of the report in footnote 1.
[3] D. Phillips and P. Simpson, National Standards, Local Risks: The Geography of Local Authority Funded Social Care, 2009-10 to 2015–16, 2017, https://ifs.org.uk/publications/9122
IFS Election 2017 analysis is being produced with funding from the Nuffield Foundation as part of its work to ensure public debate in the run-up to the general election is informed by independent and rigorous evidence. For more information, go to http://www.nuffieldfoundation.org.