


Yesterday, the Conservative Party proposed changes to the rules governing who is eligible for government funding for social care, and backed away from a lifetime cap on care costs. In this observation, we discuss those changes and lay out their potential effects. Taking the population of people in their 70s in England we estimate that, on becoming in need of care in their own home, 12-17% would be eligible for state support under current rules but would not be eligible under the new rules proposed by the Conservatives. Others would find they needed to use more of their own wealth to fund the costs of care in their home before the state stepped in.
What is happening to funding for social care?
Unlike health care, social care services in England are not provided free of charge for everyone. Rather, local authorities in England provide financial assistance to adults who have insufficient financial means to fund their own use of care services.
Spending on social care in England fell by 8% in real-terms between 2009-10 and 2016-17 as a result of cuts to funding for local government. In response to widespread belief that the system is underfunded, current plans are for councils to receive enough money by 2019-20 to reverse all the cuts that have been made since 2009–10 if they choose to do so. The Labour Party have pledged to offer a little more money for social care than is currently planned, and the Conservative manifesto also suggests some additional funds would be made available.
How common is it to need social care?
In England in 2015–16, 783,000 adults were receiving local authority contributions towards the cost of long-term care – either in their own home or in a care home. 538,000 of these were over 65, 6% of the over-65 population in England. [1] Of those half a million people, most (310,000) were receiving care in their home (at an average cost of £14 to 31 an hour), with the remainder (228,000) receiving residential care (at an average cost of £553 a week) [2].
These numbers might sounds relatively small, but it is common for people to require social care towards the end of their life. Analysis for the Dilnot Commission in 2010 found that 45% of 65 year olds could expect to spend (or have spent on them) more than £25,000 on care services, and 10% could expect to spend more than £100,000[3]. Few know in advance if they will be among those needing to spend much on long-term care.
Who is eligible for help with care costs now?
Adults are potentially eligible for public funding if they have assets worth less than £23,250. If their care needs are to be met by care provided in their own home, the value of their house is excluded from the means test. If they are in need of residential care then the value of their house may be included in the calculation of their assets.
Since 2015-16 individuals who need residential care but are not entitled to financial assistance from their local authority because the value of their house puts them over the asset threshold have had the option of making a deferred payment agreement with their local authority, which means that they do not have to sell their house during their lifetime to pay for their care costs. Their local authority would then fund their care during their life, and reclaim these costs after the individual’s death.
Even if someone is eligible for public funding on the basis of the value of their assets, local authorities are still allowed to ask them to pay some of the cost of their care on the basis of their income. When deciding how much to ask for, local authorities must leave everyone with at least a minimum amount of income (set nationally) which depends on whether they are receiving residential or home care.
What are the proposed changes?
The Conservative party have proposed two changes to the rules governing eligibility for public funding. The first is to raise the asset threshold from £23,250 to £100,000 for both residential care and care provided in the home. The second is to include housing wealth in the measure of assets considered when assessing eligibility for support for home care (and correspondingly expand deferred payment agreements to cover home care too).
The tables below look at the assets of those aged between 70 and 79 in England, and examine how these changes would potentially affect the eligibility of this group to state support for residential and home-base care should they end up needing it. The current rules governing exactly which assets count in the means-test are complicated , and quite what rules the Conservatives are proposing is unclear. We model two scenarios:
1. For those living with a partner, half of the couple’s total wealth is counted (including housing wealth where appropriate).
2. For those living with a partner, half of the couple’s non-housing wealth is counted, along with their total housing wealth (where appropriate).
The difference between these scenarios occurs when a couple has housing wealth between £100,000 and £200,000. If one member of the couple needed care, it is unclear whether the whole value of the house would be counted (rendering them ineligible) or only half of the value (leaving them eligible). In both scenarios, all the wealth of single individuals is included, and non-housing wealth is split evenly between couples.
Table 1 focuses on eligibility to public funding for residential care. It shows that 15% of individuals would see their eligibility to public funding unaffected by the proposed change, as they have assets below the old threshold (and therefore also below the new, higher, threshold). The remaining 85% could potentially gain from the Conservative proposal if they needed residential care – an additional 5-16% would be eligible for public funding immediately, and the remaining 69-80% would see state support kick in sooner if they ended up using their assets to pay for residential care.
Table 1. Assets for the purposes of existing and proposed means-test for state support with costs of residential care (% of 70-79 year olds in England)
|
Level of total assets |
Assuming all housing wealth counts for both members of couple |
Assuming housing wealth split 50-50 |
|
£0-£23,250 |
15% |
15% |
|
£23,250-£100,000 |
5% |
16% |
|
£100,000+ |
80% |
69% |
Source: Authors’ calculations using the English Longitudinal Study of Ageing, wave 7.
Table 2 examines eligibility to public funding for home care. It shows that:
- around a quarter would see their potential eligibility unaffected, as they are below both the old and the new asset thresholds.
- between a quarter and a third of 70-79 year olds would potentially lose eligibility for help with home-based care: they have less than £23,250 in non-housing wealth, but over £100,000 when housing is included.
- A further 45% of the group could find that public funding does not kick in as quickly if they end up using their wealth to fund care costs. Under the old system, they would be eligible as soon as non-housing assets fell below £23,250, regardless of how much housing wealth they have. Under the new system, they could then also be required to spend any housing wealth in excess of £100,000 before becoming eligible for public funding.
Table 2. Assets for the purposes of existing and proposed means-test for state support with costs of home care (% of 70-79 year olds in England)
|
Assuming all housing wealth counts for both members of couple |
Assuming housing wealth split 50-50 |
|||||
|
Total assets below £100,000 |
Total assets above £100,000 |
Total assets below £100,000 |
Total assets above £100,000
|
|||
|
Non-housing assets below £23,250 |
18% |
34% |
28% |
24% |
||
|
Non-housing assets above £23,250 |
2% |
46% |
3% |
45% |
||
Source: Authors’ calculations using the English Longitudinal Study of Ageing, wave 7.
As explained above, it is not just wealth that affects individuals’ eligibility for state support with the costs of social care, but also income. This means that some of the group we identify as potentially losing out as a result of this reform may in practice be no worse off, as they have incomes high enough to be ineligible for publicly funded care.
To give a sense of how important that is likely to be the Figure below takes the group of people who pass the old asset test but not the new asset test (a quarter to a third of 70-79 year olds in England), and shows the number of hours of home care per week they could be expected to self-fund (based on their income) before the local authority would help cover the costs of any additional hours.
It suggests that 20% of this group have incomes sufficiently low that they would not be expected to pay for any home-based care, and a further 35% would receive public funding if they needed more than 5 hours of a care each week. In other words, the lowest-income half of the group who fail the new asset test (but passed the old one) would be likely to lose out if they needed care. Whether the other half lost out would depend on how many hours of home care they need.
To summarise, a quarter to a third of 70-79 year olds in England would pass the old asset test for home care but fail the new one proposed by the Conservatives. Of those, at least half would have got public funding for home care under the old system if they needed it (the other half have too high an income to be eligible). Hence the new policy might directly affect the eligibility of 12-17% of this group to state support with costs of care in their home.
Figure. Self-funded hours of care each week among those who pass the old asset test for home care, but fail the new asset test
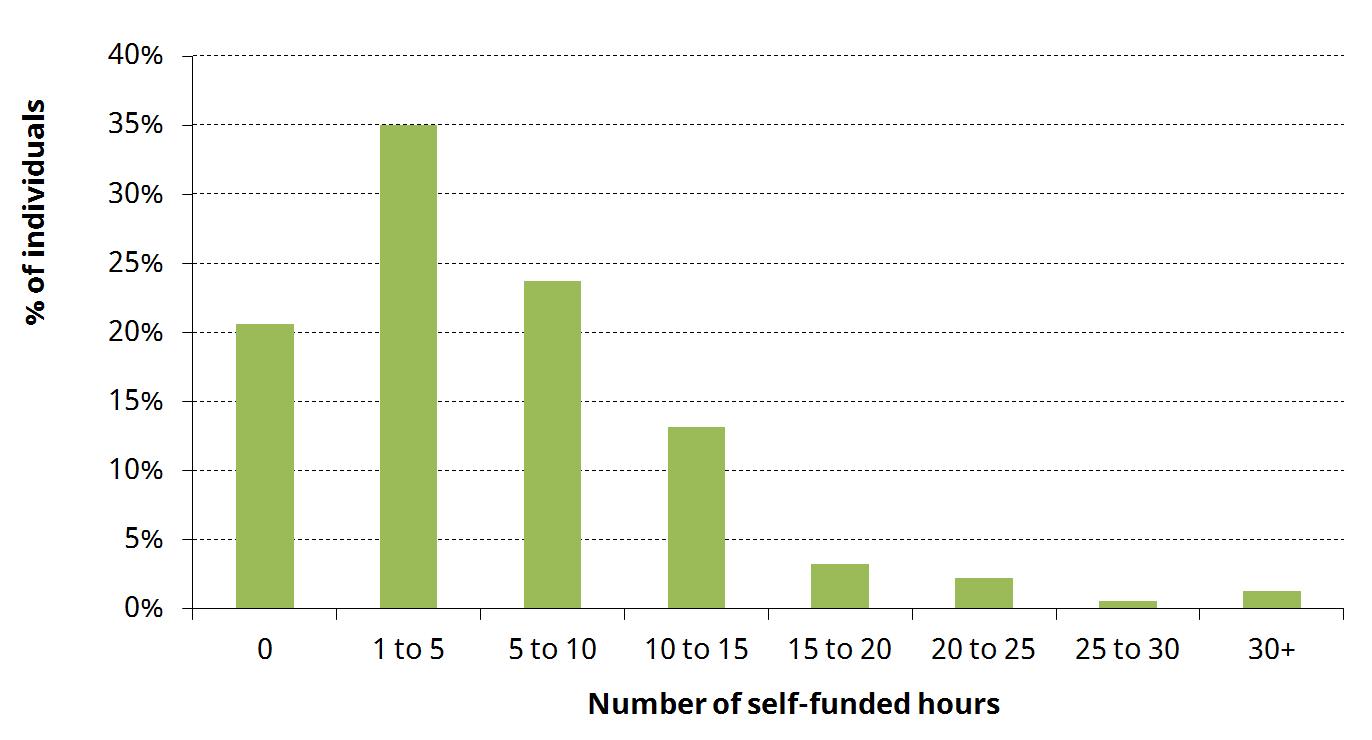
Notes: Income split evenly between couples. Figure presented for those who pass the old asset test but fail the new asset test in our second scenario. Figures for those affected in the first scenario are extremely similar.
Source: Authors’ calculations using the English Longitudinal Study of Ageing, wave 7, national minimum income thresholds from local authority circular January 2017 (Social care - charging for care and support), and unit costs of day care (England average for external provision) from NHS Digital, Personal Social Services: Expenditures and Unit Costs England 2015-16.
What is the impact on public spending?
64% of local authority spending on care for the over-65s is for residential care, with the remainder spent on home care. The Conservative plans would tip this balance towards a greater fraction of spending on residential care – increasing public funding for residential care (by raising the asset threshold) but decreasing public funding for home care (by including housing wealth in the asset test).
It is not possible to be confident whether the change would increase or decrease overall spending relative to the current system on care on the basis of publically available data. What is clear is that the proposal is less generous than the version of the Dilnot commission’s recommendations that have already been put into law
What about the Dilnot Commission?
In 2011, the Dilnot Commission proposed a new system of social care funding which included a cap on the amount an individual would have to pay towards the cost of their social care over the course of their life. Once they have met the cap, all further care costs would be covered by the state.
At the time, the government accepted the basic idea behind the proposal, though it planned to set the cap at £72,000 (higher than the £25,000 to £50,000 (in 2010 prices) proposed by the commission). Implementation of the reform was planned for 2016 and then pushed back to 2020. The Conservative manifesto has now dropped the planned reform entirely.
What has been lost by abandoning the cap?
The fundamental thing to understand about the funding of social care is that it is an insurance problem. Individuals face a low but meaningful risk of incurring very high care costs – 10% of adults age 65 could face costs of more than £100,000. People don’t know whether it will happen to them, and lots of these care costs don’t arise until the end of life.
Ideally, you’d like to buy some insurance reasonably early on in your life that would pay out if you ended up one of the unlucky few. But insurance markets don’t exist that will let you buy social care insurance so far in advance.
A life-time cap on care costs, as proposed by the Dilnot Commission, is a solution to the insurance problem. It is effectively a form of social insurance, funded from general taxation. It may also make it easier for a private market to emerge that would offer insurance against care costs up to the cap.
By contrast, the Conservative plan makes no attempt to deal with the fundamental challenge of social care funding. That is the big problem – not how many people might win or lose.
Notes
[1] HSCIC Community Care Statistics 2015–16, table LTS001a. Figures exclude ‘commissioned support only’.
[2] HSCIC Personal Social Services Expenditure and Unit Costs 2015-16. Hourly cost of day services differs depending on whether provision is directly provided by local authority employees or commissioned externally. Day care costs are average across England for all age groups. Residential costs are specific to the over 65s.
[3] Fairer Care Funding Volume II: Analysis and evidence supporting the recommendations of the Commission on Funding of Care and Support, July 2011
IFS Election 2017 analysis is being produced with funding from the Nuffield Foundation as part of its work to ensure public debate in the run-up to the general election is informed by independent and rigorous evidence. For more information, go to http://www.nuffieldfoundation.org.