

NHS and social care
NHS and social care
In 2015–16, the UK public sector spent 8.9% of UK national income on health and social care. This is equivalent to 22.2% of total public spending. Since 2010-11, the National Health Services (NHS) has been relatively well protected from the large cuts seen by most departments. However, health spending has still increased at a historically slow pace over this period, and the NHS faces many demand and cost pressures. Over the same period, adult social care has faced funding cuts, while facing many of the same pressures. Policymakers will therefore continue to be faced with important decisions over how to allocate funding between the NHS, social care, and other areas of spending.
UK public spending on health has increased considerably over time, rising from £12.8 billion in 1955–56 to £143.7 billion in 2015–16 (in 2017–18 prices). This is much larger than the growth in the size of the economy over the same period, so health spending as a share of national income has more than doubled, growing from 2.8% of national income in 1955–56 to 7.4% in 2015–16. The figure (below) shows how spending changed in each year during this period.
Figure 1: Annual changes to real health spending

The last six years have seen health spending rise slowly by historical standards. Between 1955–56 and 2015–16, the average annual real increase in health spending was 4.1%. Since 2009–10, spending has increased by only 1.3% per year on average. In fact, the period between 2010–11 and 2014–15 witnessed the slowest five-year average increase in health spending since a consistent time series began. Despite this, the share of public service spending accounted for by health is at a historical high of 29.9% in 2015–16. This share has also increased at the same rate over the past few years as it did during the 2000s, when health spending was growing at a historically high rate. This is because the health budget has been protected from the cuts to public spending implemented since 2010.
In England, NHS spending is set to increase in real terms by 11.3% between 2014–15 and 2020–21. This is more than is required to meet the government’s commitment to provide the £8 billion (2017–18 prices) requested by NHS England Chief Executive Simon Stevens in 2014. Estimates indicate that these increases should be around the level of additional spending required to meet demographic pressures. However, the NHS will continue to face other demand and cost pressures. It is also noticeable that NHS funding – to which the government’s £8 billion commitment applies – will increase at the cost of other parts of Department of Health spending. As a result, the non-NHS part of the DH budget will fall by £3.4 billion (or 21%) between 2014–15 and 2020–21.
If the NHS has been given modest budget increases, the experience of social care funding has been markedly different over the last few years. In England, real-terms public spending on local-authority-organised adult social care fell by 8% between 2009–10 and 2016–17. The fall in spending on adult social care occurred despite increases in transfer payments from the NHS to local authorities contributing to the cost of social care (at the cost of reducing NHS spending on other services). In 2016–17, these NHS transfers were worth around £1.9 billion, 11% of what local authorities spent on adult social care.
In addition to these reductions in funding, need for care has increased due to population growth. Per adult spending therefore fell by 13.5% between 2009–10 and 2016–17 (from £439 to £379 per adult). These spending cuts have not been implemented in an even way across the country, with the greatest cuts in areas which previously had the greatest spending and the most need. Between 2009-10 and 2015-16, the cuts averaged 11% in real-terms per-adult spending, and varied from cuts of 18% in the North East and London, to 2% in the South West.
Local authorities have been allocated extra money for social care in future. Under current plans, local authorities will have enough money to reverse all social care cuts by 2019–20 if they choose to do so. This can be seen in the figure below, where the light green line shows potential total spending on local authority-organised adult social care.
Figure 2: Spending on local authority-organised adult social care, 2009–10 to 2016–17
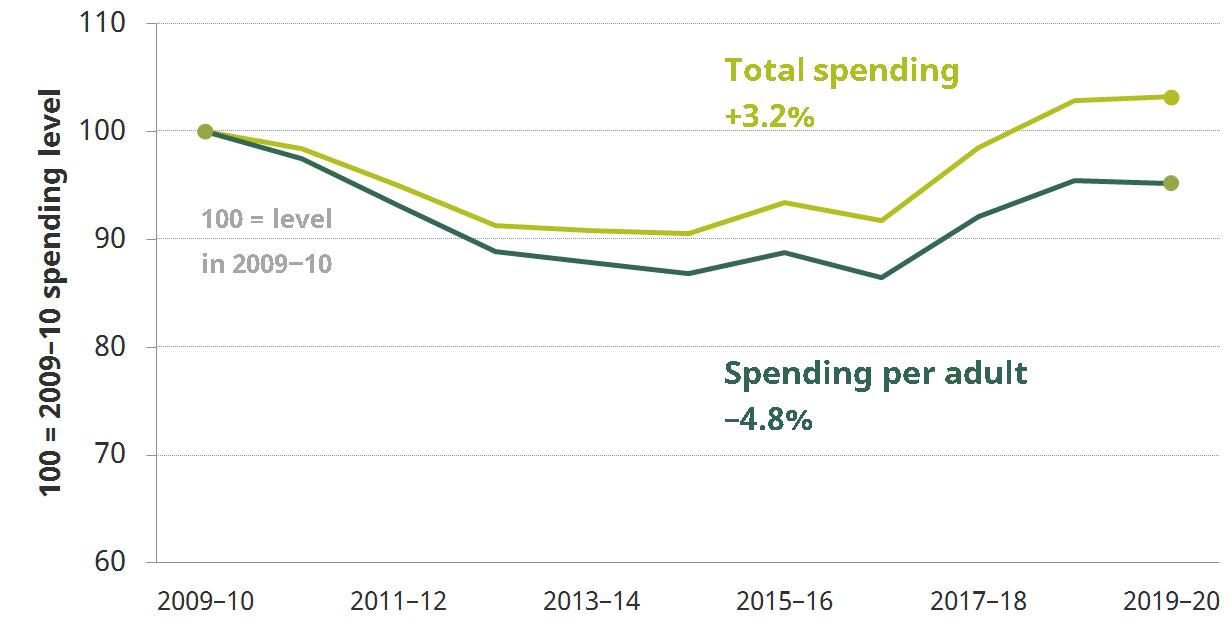
However, this does not take into account population growth. Even if local authorities use all of the additional funding for social care, per-adult social care spending will still be 4.8% lower in 2019-20 than in 2009-10. It is also unclear whether local authorities will spend all of this additional money on social care – although the funding is ring-fenced for social care, local authorities may have some flexibility to use it for other services. To satisfy the ring-fence they must demonstrate that they are spending more than they otherwise would on adult social care, but it is difficult to prove that they are not. If some of this funding is used for other services then social care spending will not increase by as much as shown in the figure.
Election briefing notes
Polly Simpson, Public spending on adult social care in England,
George Stoye, UK health spending,
Observations
Andrew Hood and Polly Simpson, Social care – a step forwards or a step backwards?, 19 May 2017
Rowena Crawford and George Stoye, Challenging times ahead for the NHS regardless of who wins the election, 30 May 2017
Newspaper articles
Polly Simpson, Social care spending: worrying trends, 11 May 2017
Useful resources
Green Budget chapters
Daria Luchinskaya, Polly Simpson and George Stoye, UK health and social care spending, in IFS Green Budget 2017, 7 Feb 2017
Reports and briefing notes
George Stoye, UK health spending, 3 May 2017
David Phillips and Polly Simpson, National standards, local risks: the geography of local authority funded social care, 2009–10 to 2015–16, IFS report R128, 5 April 2017
Rowena Crawford and George Stoye, The prevalence and dynamics of social care receipt, IFS report R125, 10 February 2-17
Observations
George Stoye, How will the receipt of social care change in future?, 10 Feb 2017
Newspaper articles
Polly Simpson, The impact of extra social care funding will vary, Local Government Chronicle, 28 Mar 2017
Videos
Andrew Hood, What's happening to NHS spending?, 7 Mar 2017
Polly Simpson, Adult social care spending in England, Post-Budget presentation, 9 Mar 2017
George Stoye, Health and social care, IFS Green Budget presentation, 7 Feb 2017